


1 仿真与实验
1.1 仿真分析
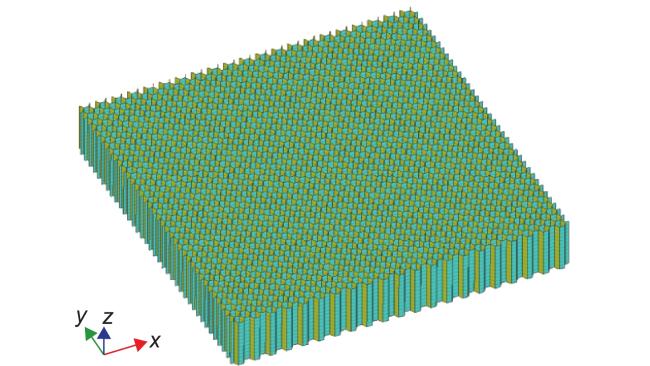
表 1 芳纶纸力学性能参数Table 1 Mechanical performance parameters of aramid paper |
| Parameters | Value |
| Longitudinal Young’s modulus,E1/MPa | 5000 |
| Transverse Young’s modulus, E2/MPa | 4000 |
| Poisson’s ratio, v12,v13,v23 | 0.2 |
| Shear modulus, G12 ,G13 ,G23/MPa | 1450 |
| Longitudinal tensile strength, Xt/MPa | 90 |
| Longitudinal compressive strength, Xc/MPa | 105 |
| Transverse tensile strength, Yt/MPa | 60 |
| Transverse compressive strength, Yc/MPa | 90 |
| Tensile strength in the direction of the paper thickness, Zt/MPa | 60 |
| Compressive strength in the direction of the paper thickness, Zc/MPa | 90 |
| In-plane shear strength, S/MPa | 44 |
| Material density,ρ/(kg·m−3) | 1100 |
1.1.1 蜂窝芯层面外变形量化分析模型
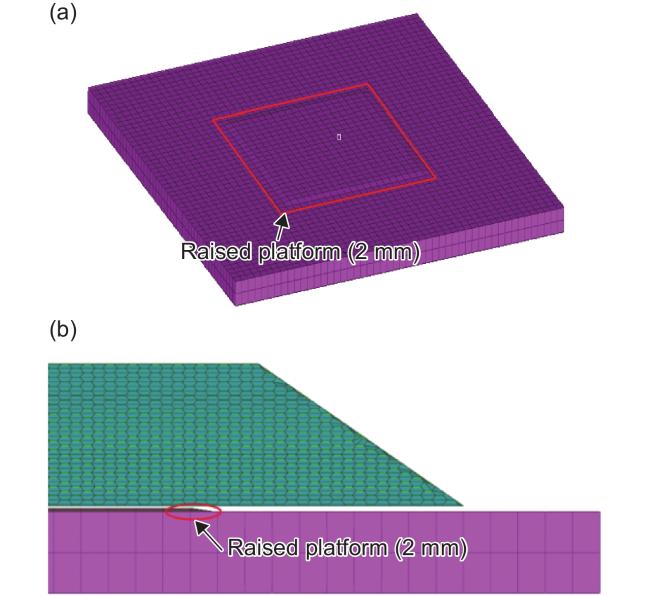
1.1.2 蜂窝芯层对凸台结构的受力传导分析
1.2 实验方法
1.2.1 原材料
表 2 实验材料Table 2 Experimental materials |
| Material name | Grade | Density | Vendor | Remark |
| Prepreg | COM970/P WC T300 3K ST | 193 g/m2 | Cytec | |
| Adhesive film | Loctite EA7000 | 244 g/m2 | Henkel | |
| Aramid honeycomb | ACT2-3.2-48 | 48 kg/m3 | ACT | The length of the edge of the core. 3.2 mm |
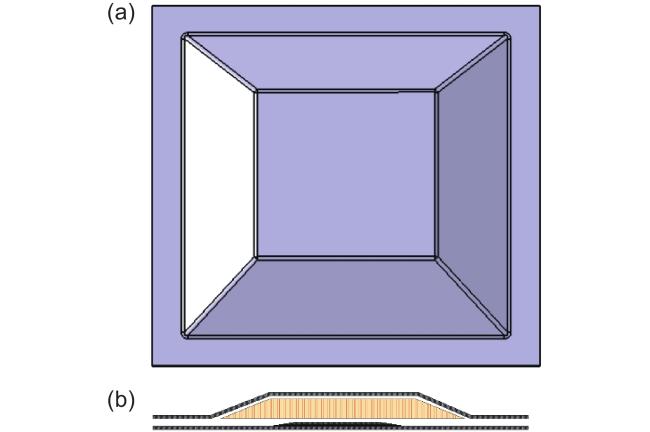
1.2.2 制造工艺
1.2.3 实验矩阵
表 3 工艺实验矩阵Table 3 Process experiment matrix |
| No. | Variable | Structure dispose | ||
| Pressure/ MPa | Thickness/ mm | Local ply height/mm | ||
| 1 | 0.03 | 70 | 1.8 | |
| 2 | 0.095 | 70 | 1.8 | |
| 3 | 0.3 | 70 | 0 | Planar fit |
| 4 | 0.3 | 70 | 2.8 | Planar fit |
| 5 | 0.3 | 70 | 2.8 | Bevel fit |
| 6 | 0.3 | 70 | 2.8 | Step fit |

2 结果与讨论
2.1 不同厚度蜂窝的变形性能分析
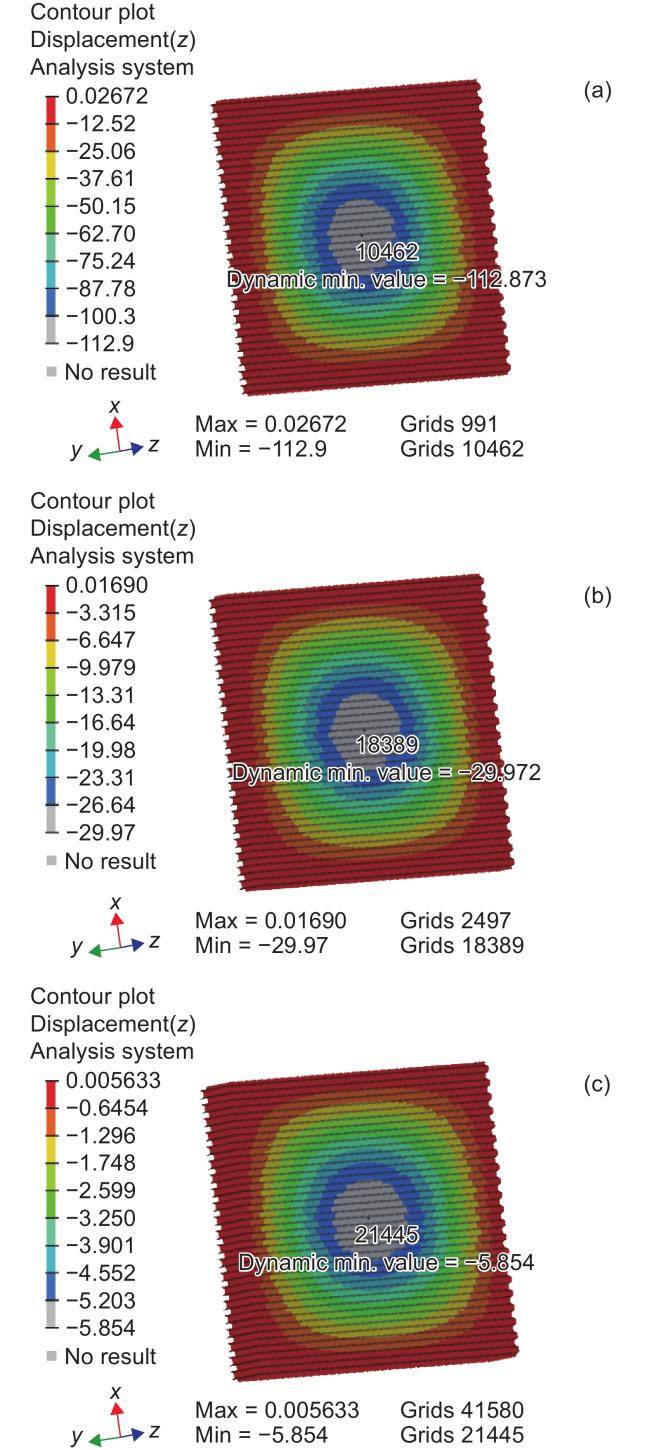
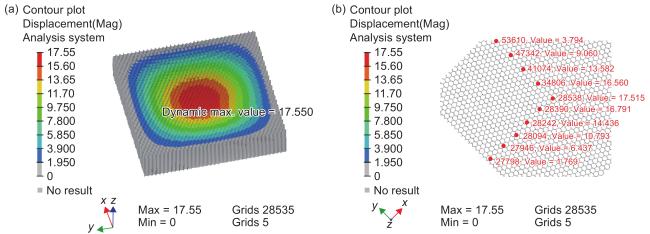
图 6 在0.1MPa压力下不同厚度蜂窝变形分布云图 (a)25 mm;(b)40 mm;(c)70 mmFig.6 Cloud map of deformation distribution of honeycomb with different thickness under 0.1 MPa(a)25 mm;(b)40 mm;(c)70 mm |
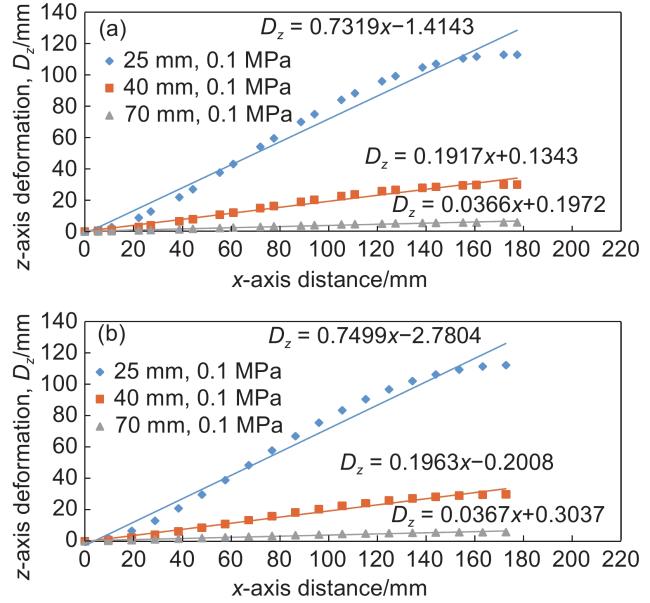
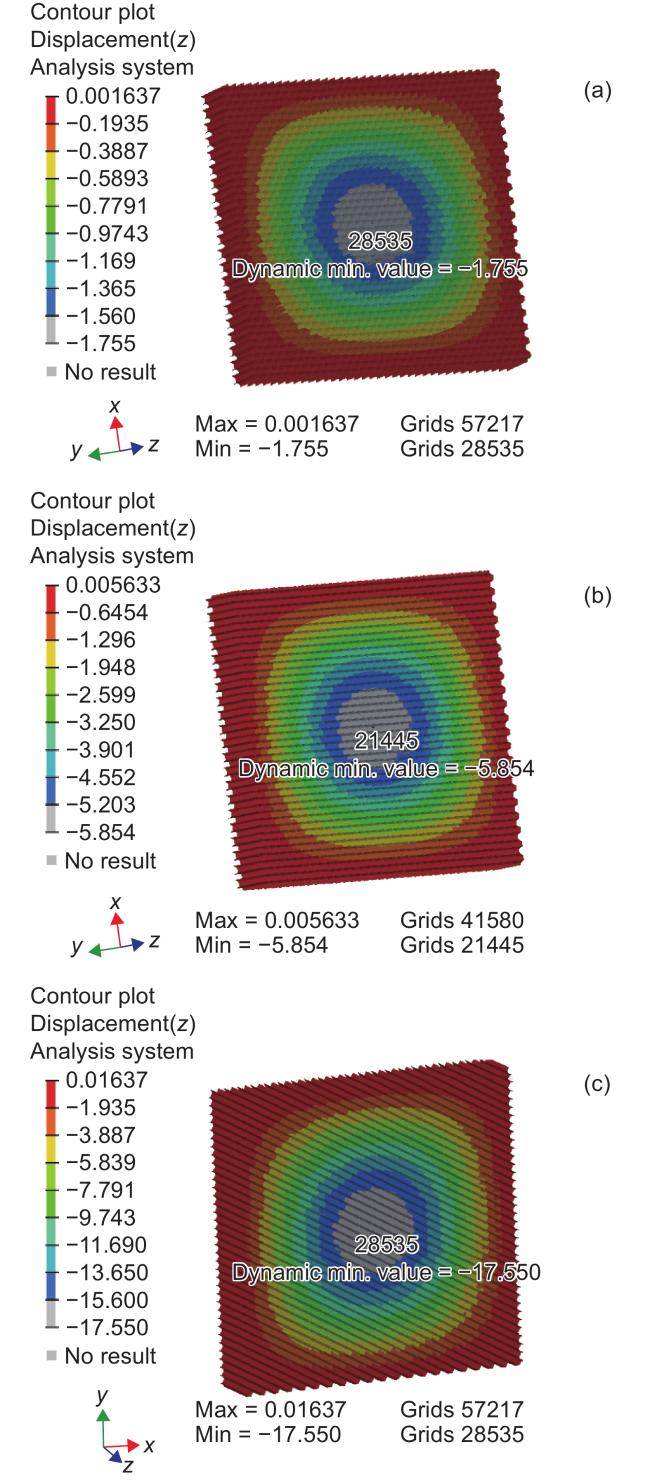
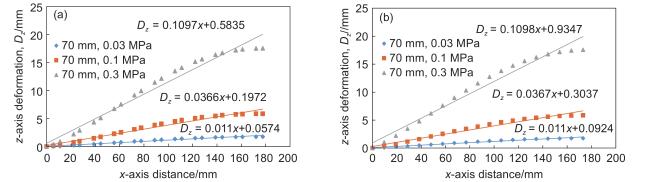
2.2 不同外部压力下蜂窝变形性能
2.3 蜂窝芯层压力传导分析结果
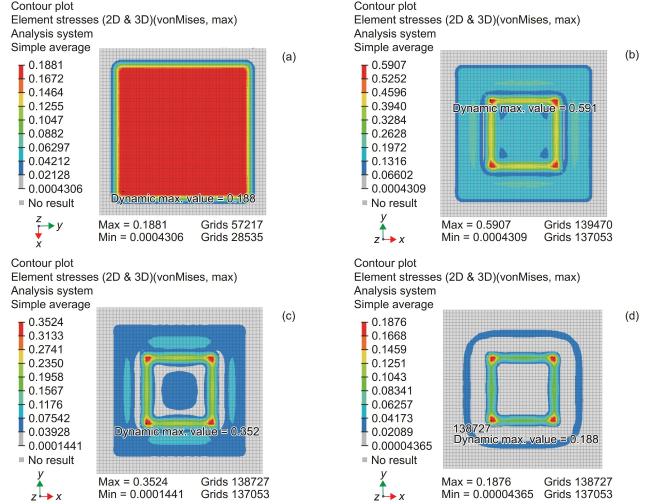
图 10 不同压力下凸台结构的应力分布 (a)0.3 MPa压力下的蜂窝(平面);(b)0.3 MPa压力下的蜂窝(凸台); (c)0.1 MPa压力下的蜂窝(凸台);(d)0.03 MPa压力下的蜂窝(凸台)Fig.10 Stress distribution of the raised platform structure under different pressures (a)0.3 MPa on honeycomb(plane); (b)0.3 MPa on honeycomb(raised platform);(c)0.1 MPa on honeycomb(raised platform); (d)0.03 MPa on honeycomb(raised platform) |
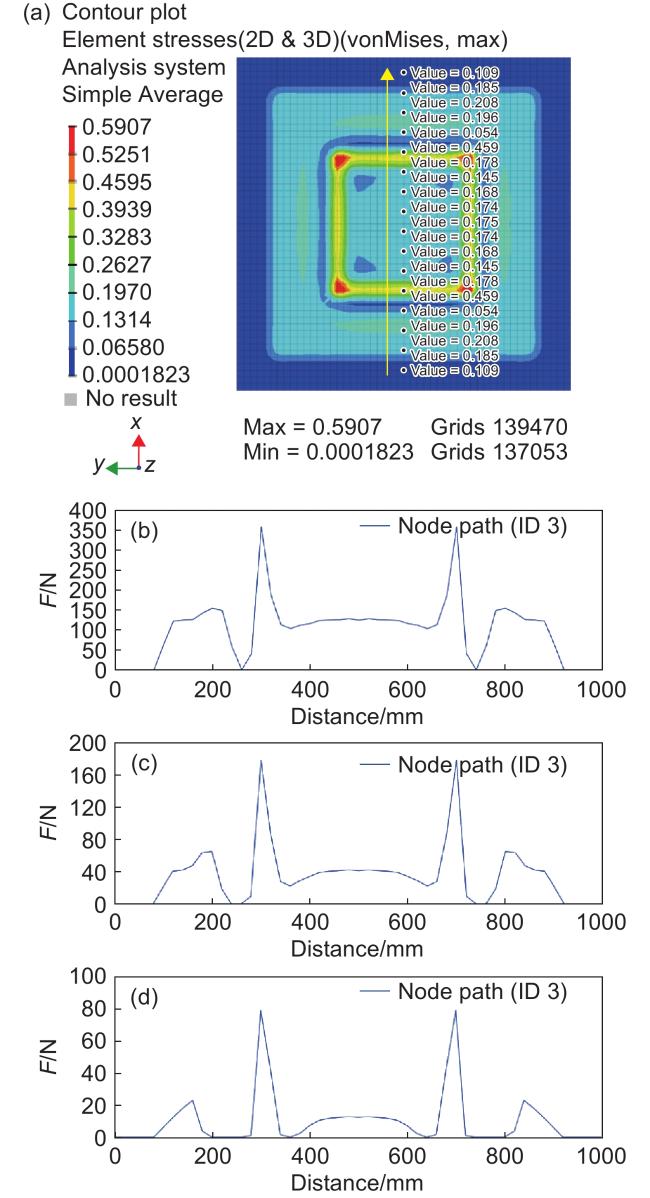
图 11 蜂窝几何中心轴L向的接触面压力分布曲线 (a)接触面上蜂窝几何中心轴压力值提取;(b)0.3 MPa下中心轴上的压力值;(c)0.1 MPa下中心轴上的压力值;(d)0.03 MPa下中心轴上的压力值Fig.11 Pressure distribution curve of the contact surface of the honeycomb L-axis to the geometric center axis (a)pressure value method of contact surface central axis;(b)pressure value of central axis under 0.3 MPa;(c)pressure value of central axis under 0.1 MPa;(d)pressure value of central axis under 0.03 MPa |
2.4 典型结构样件实验
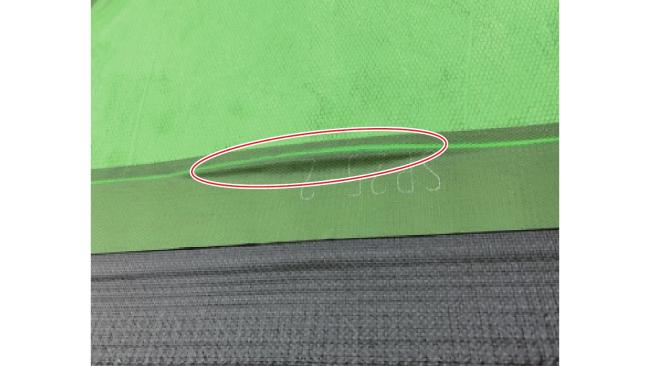
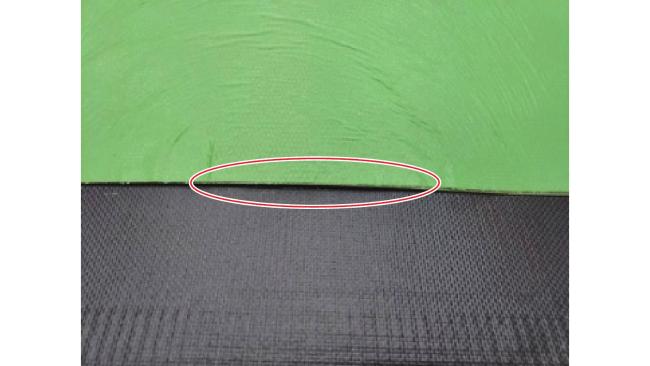
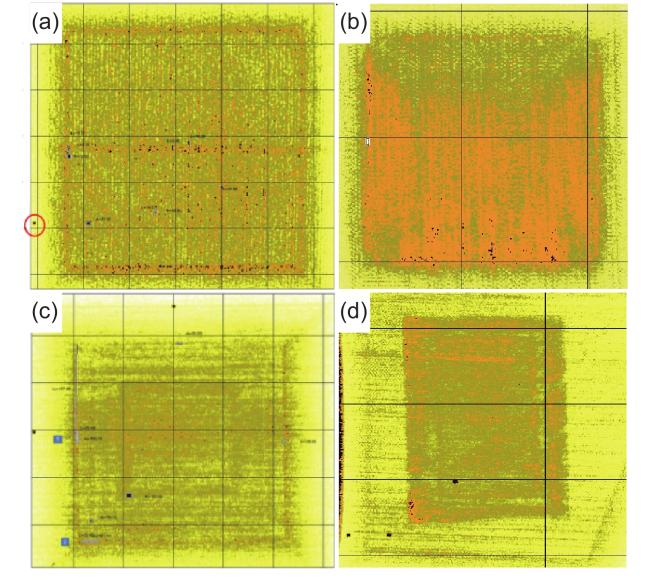
图 14 不同蜂窝配合状态的无损检测图像 (a)无加强层,蜂窝顶部最优区域平均值为63.2 dB;(b)平面配合加强区,蜂窝顶部最优区域平均值为56.5 dB;(c)斜面配合加强区,蜂窝顶部最优区域平均值为61.8 dB;(d)阶梯配合加强区,蜂窝顶部最优区域平均值为62 dBFig.14 Nondestructive testing images of different honeycomb coordination states (a)No reinforcement layer, the average value of the top optimal area of the honeycomb is 63.2 dB;(b)planar fit reinforcement layer, average value of the top optimal area of the honeycomb is 56.5 dB;(c)bevel fit reinforcement layer, average value of the top optimal area of the honeycomb is 61.8 dB;(d)step fit reinforcement layer, average value of the top optimal area of the honeycomb is 62 dB |